Understanding the Metrics Dashboard
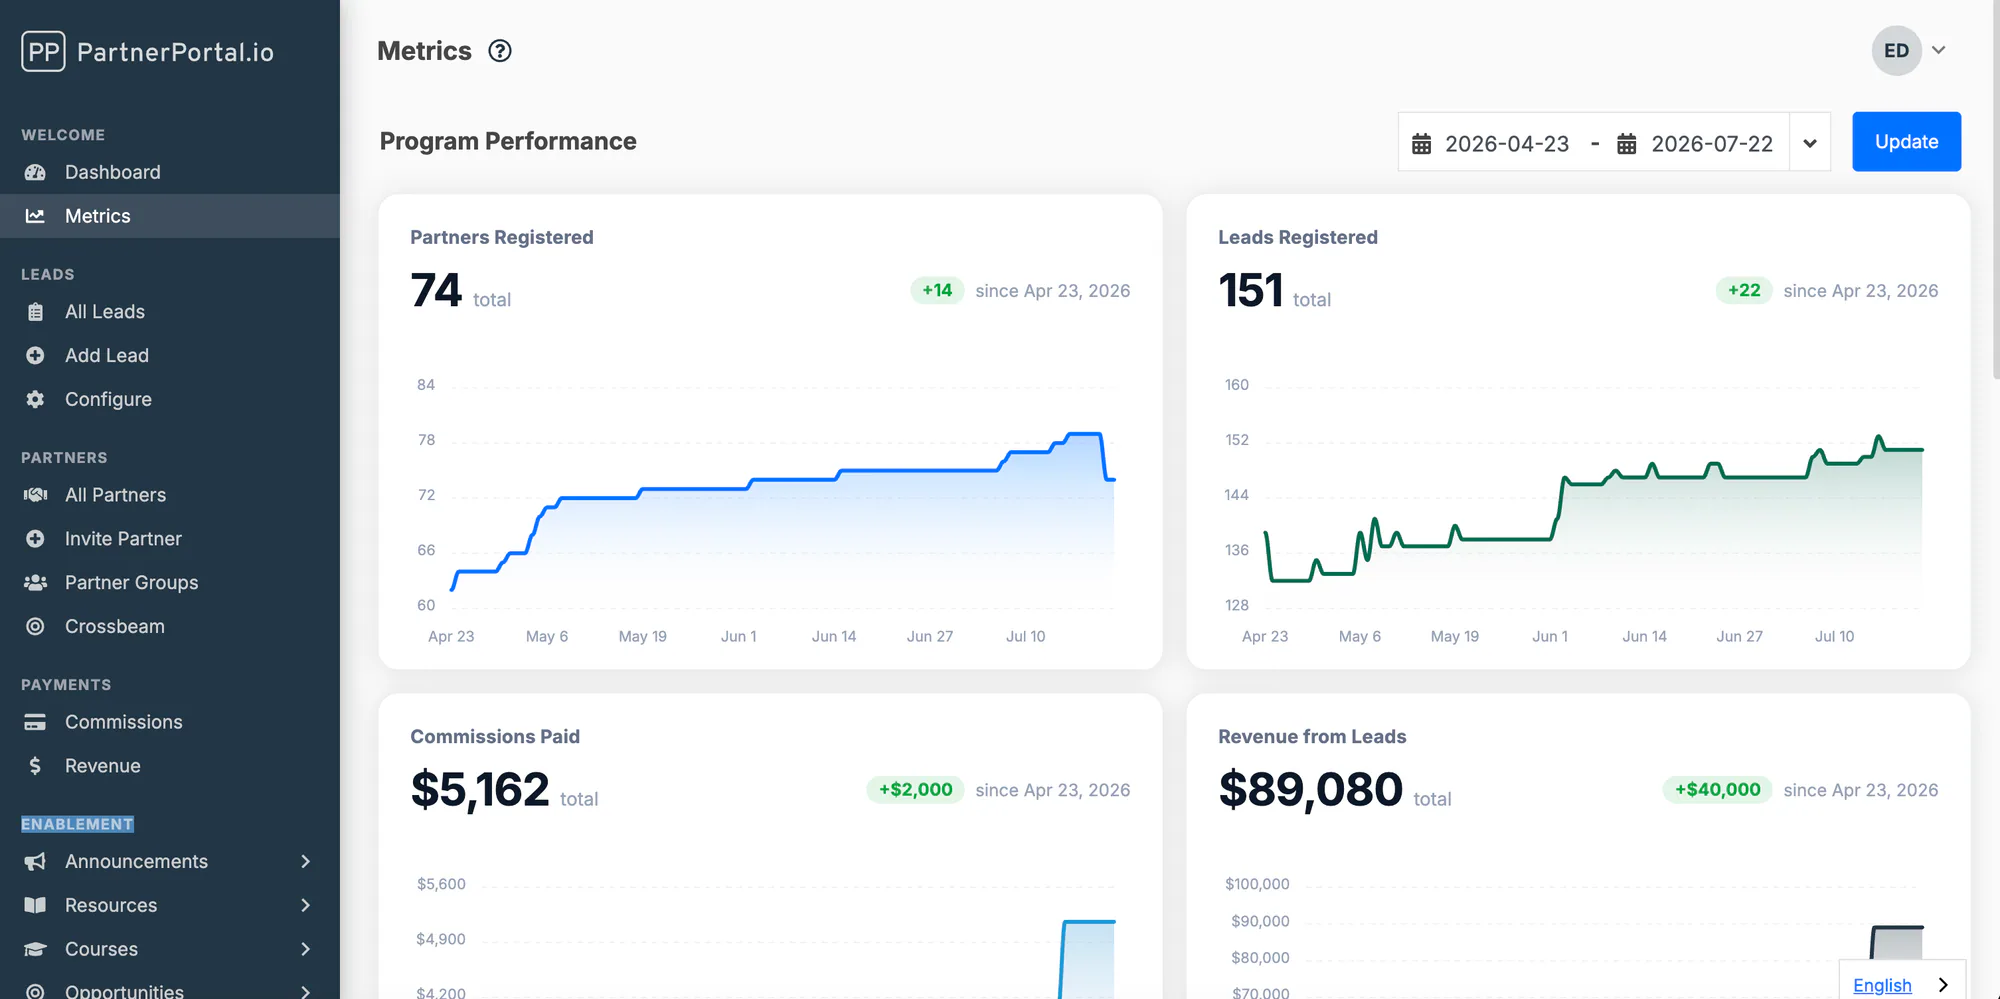
The Metrics dashboard gives you insight into how your partner program is performing. Choose the time period you want to review, and every metric on the page updates to reflect it.
Key Metrics
Section titled “Key Metrics”The top of the dashboard summarizes the headline numbers for the selected period:
- Partner Registrations — how many new partners registered during the period
- Leads Registered — how many new leads were submitted during the period
- Commissions Paid — the total amount of commissions paid during the period
- Revenue from Leads — the total revenue generated from leads during the period
Partner Impact
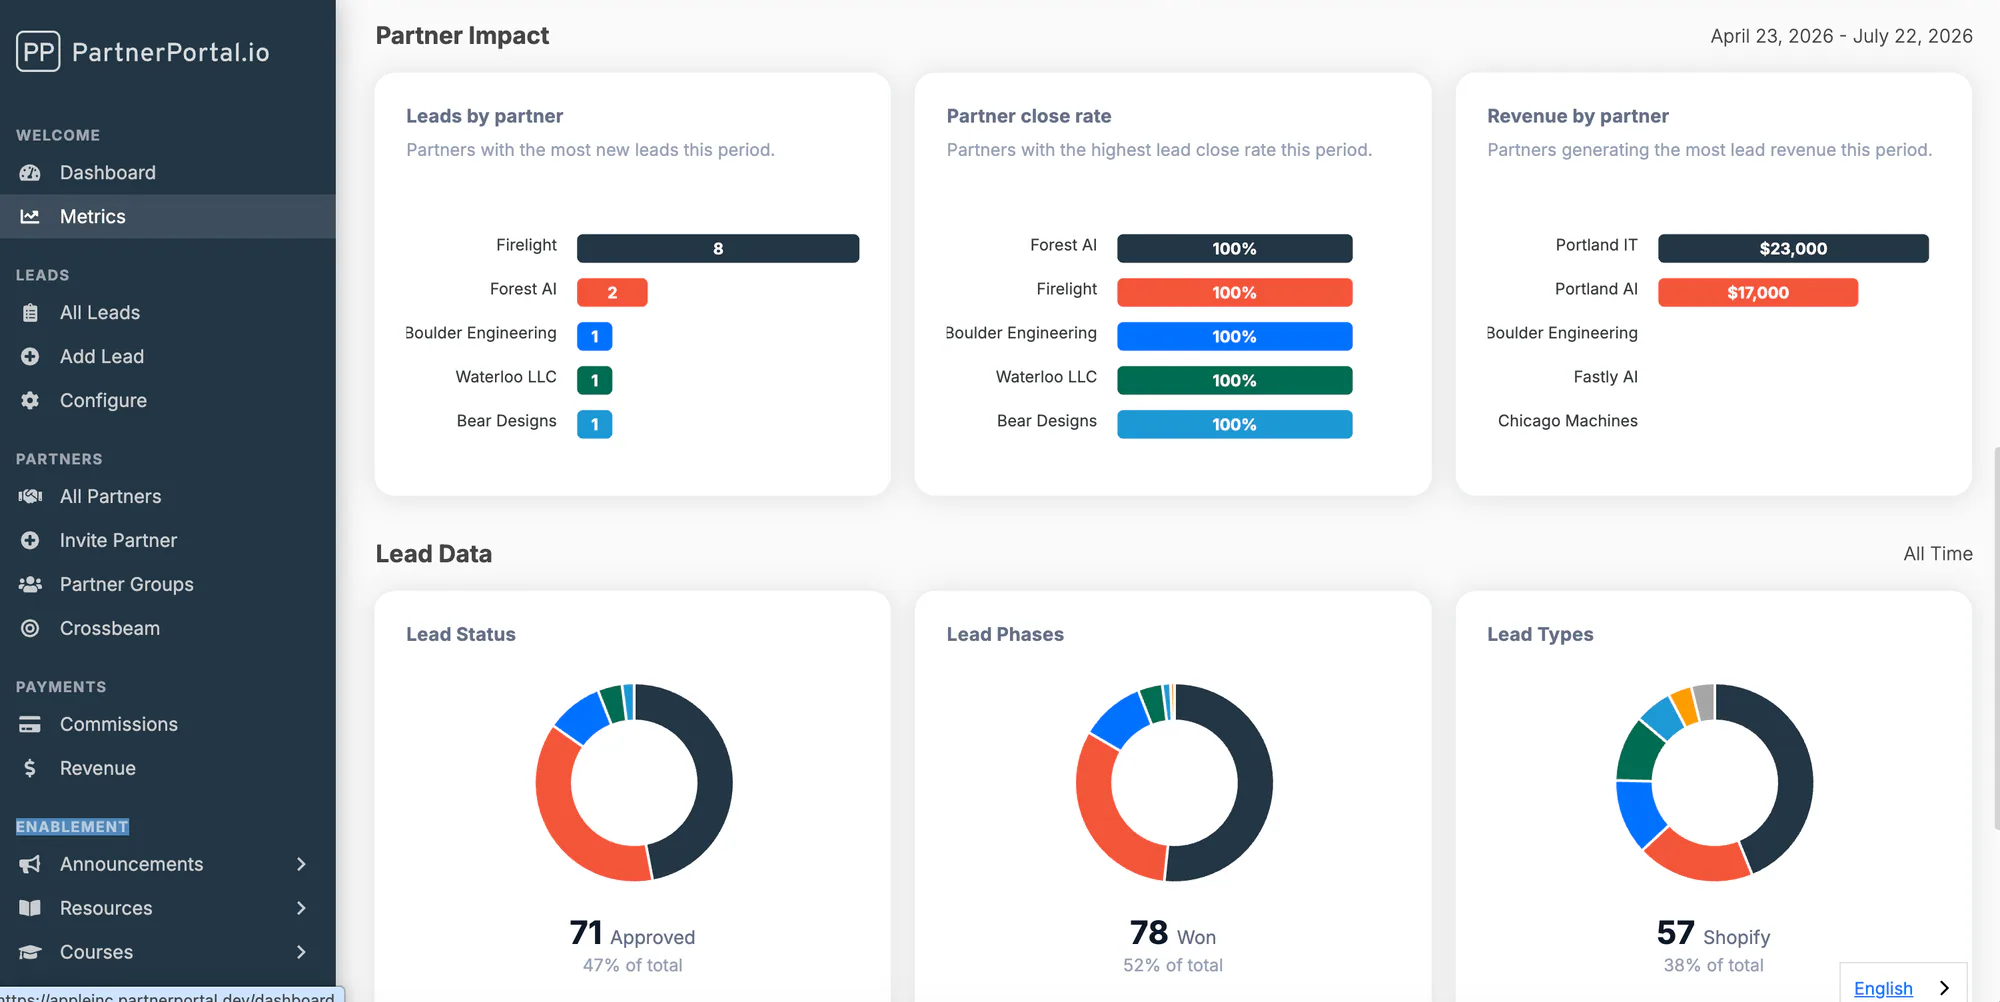
Section titled “Partner Impact”This section highlights your top-performing partners for the selected period:
- Leads by partner — partners who submitted the most new leads
- Partner close rate — partners with the highest lead close rate (%)
- Revenue by partner — partners who generated the most lead revenue
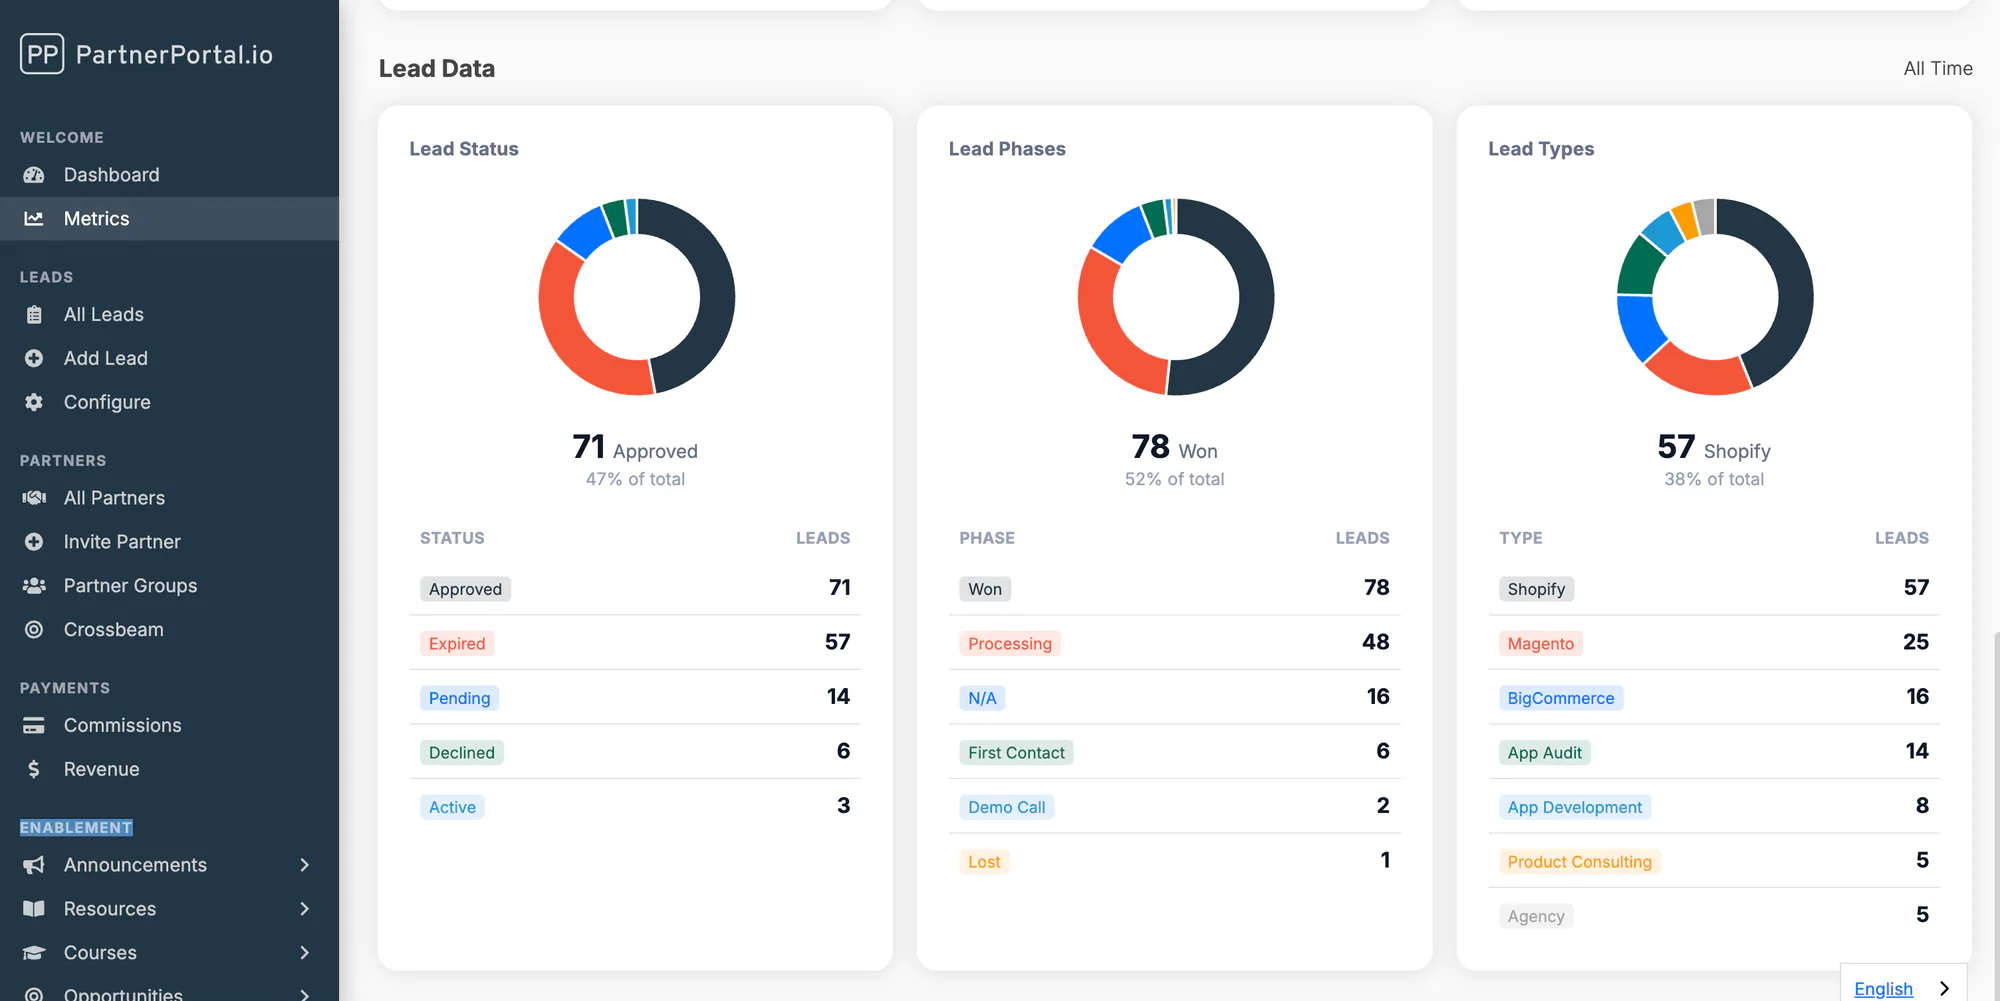
Lead Data
Section titled “Lead Data”This section breaks down your leads three ways:
- Lead Status — how many leads fall into each status: Approved, Expired, Pending, Declined, and Active
- Lead Phases — how many leads fall into each phase. Phases are specific to your program, so this reflects the phases you’ve set up.
- Lead Types — how many leads fall into each type. This also reflects the lead types specific to your program — you can customize your phases and lead types from the Settings tab.
Each breakdown shows a donut chart plus a table with the exact lead count for every status, phase, and type.