
Channel Performance Metrics That Matter (and How to Analyze Them)
The channel performance metrics that actually predict revenue — leading vs. lagging indicators, the KPIs worth tracking, how to run a channel performance analysis, and the partner scorecard that turns numbers into action.
Written by the team at PartnerPortal — PRM software used to run B2B partner and channel programs.
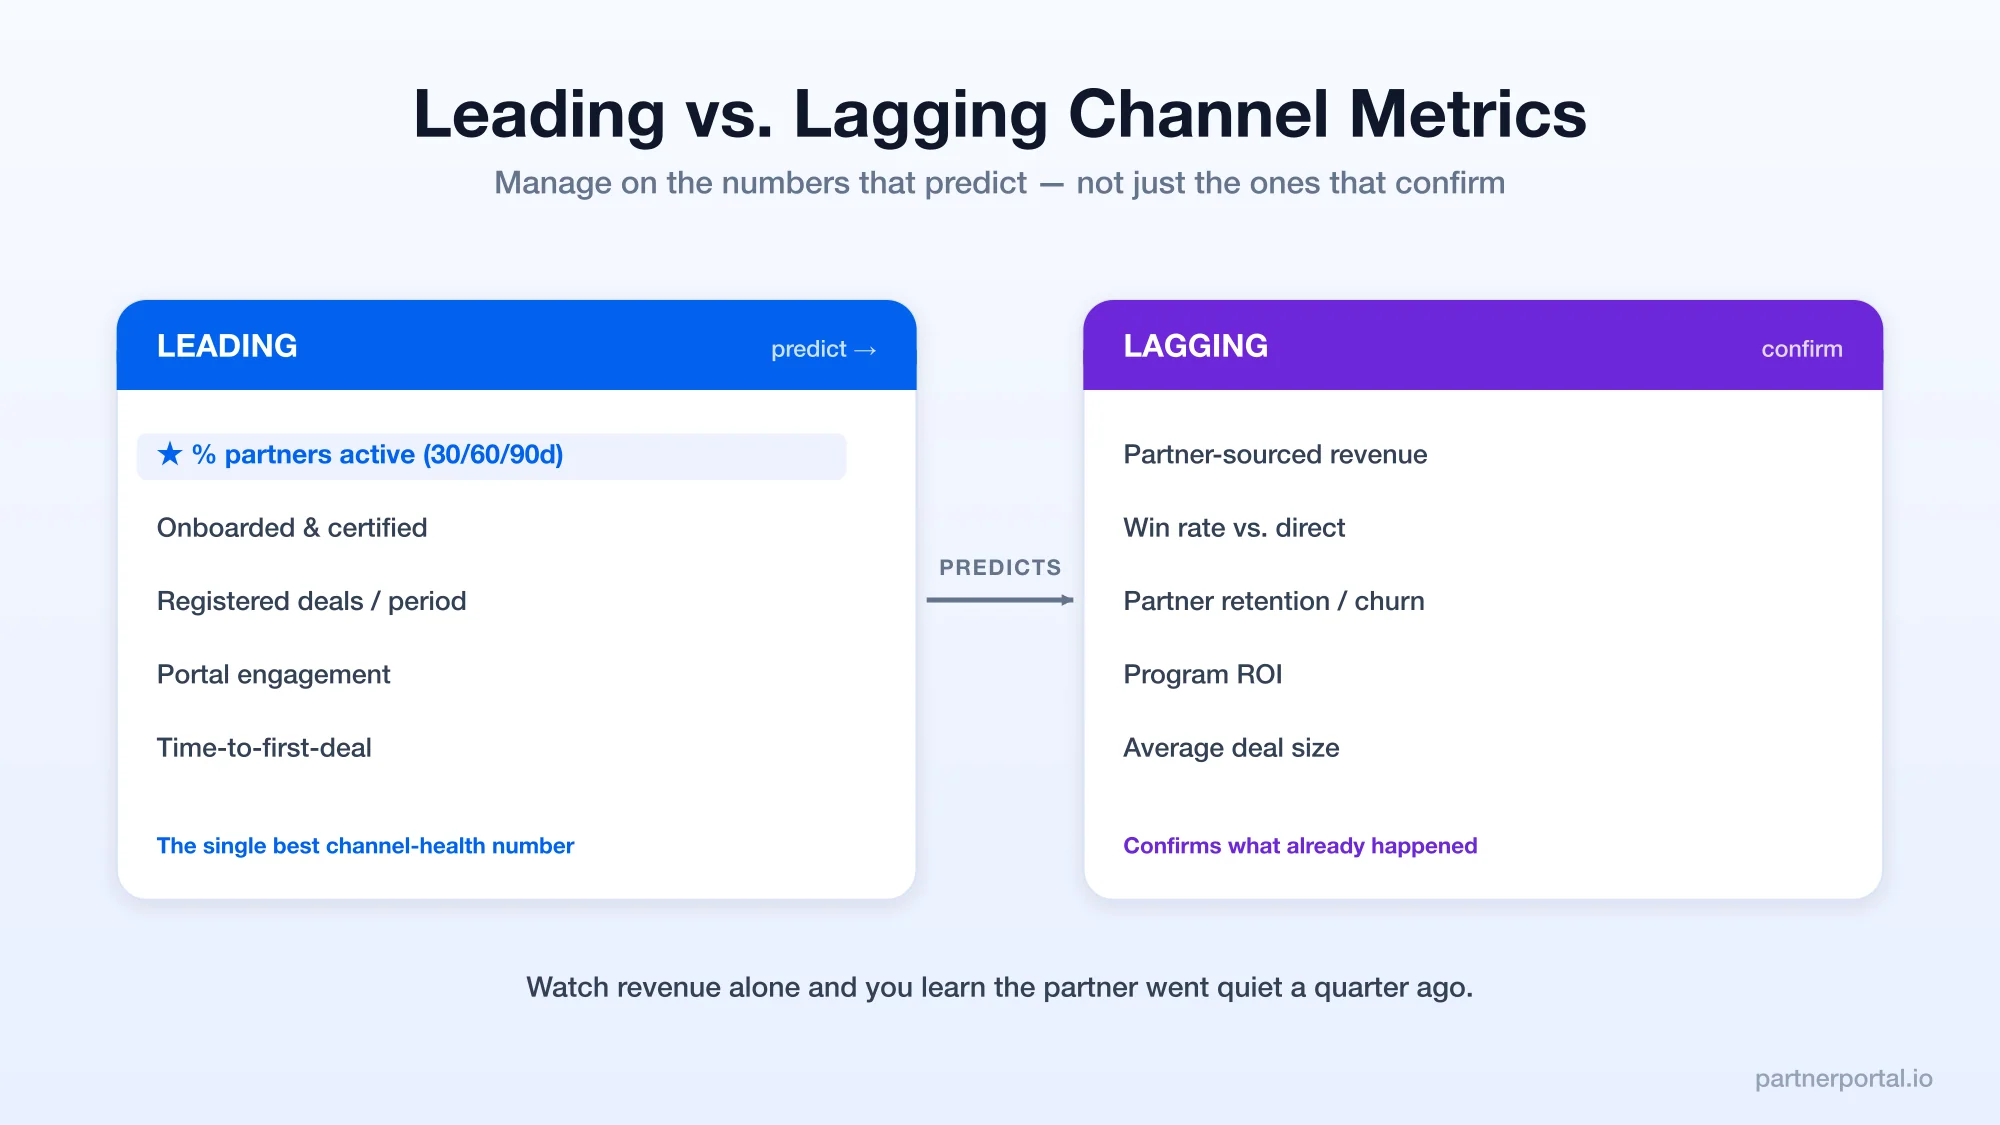
Most channel programs measure the wrong thing, or measure the right thing too late. They watch partner-sourced revenue — a number that only moves after a partner has already been disengaging for a quarter — and miss the leading signals that would have let them act. Good channel measurement is less about a bigger dashboard and more about watching the handful of numbers that actually predict what’s coming.
TL;DR: Effective channel measurement rests on a few principles:
- Balance leading and lagging indicators — leading predicts, lagging confirms.
- The percentage of active partners is the single most important number in most channels.
- Score partners consistently on activity, pipeline, and results.
- Run a real performance analysis on a cadence — turn metrics into decisions.
- Trust your data — accurate metrics require the PRM and CRM to stay in sync.
This piece expands the “Measure” stage of channel management.
Leading vs. lagging indicators
Every channel metric is either leading (it predicts a future outcome) or lagging (it confirms a past one). Healthy programs watch both, but they manage on the leading ones.
- Leading indicators tell you what’s about to happen: how many partners are active, how many have been onboarded and certified, how many deals are being registered, and how engaged partners are with your portal and content. When these soften, revenue will soften next quarter — but you have time to act.
- Lagging indicators tell you what already happened: partner-sourced revenue, win rate, retention, ROI. They’re essential for reporting and forecasting, but by the time they move, the cause is months old.
The mistake nearly every struggling program makes is managing exclusively on lagging indicators — watching revenue, reacting when it dips, and discovering the partner went quiet a quarter ago. Leading indicators are the early-warning system.
The channel metrics that matter
You don’t need a hundred KPIs. You need a balanced handful across both categories:
| Leading indicators (predict) | Lagging indicators (confirm) |
|---|---|
| Percentage of partners active in last 30/60/90 days | Partner-sourced revenue / ARR |
| Partners onboarded and certified | Partner-sourced win rate vs. direct |
| Registered deals per period | Partner retention / churn |
| Portal engagement and content usage | Program ROI (revenue vs. program cost) |
| Time-to-first-deal for new partners | Average partner deal size and margin |
A few worth calling out:
- Partner-sourced win rate vs. direct is one of the most persuasive channel metrics — it tells you whether partner-influenced deals close better than direct ones, which is often the real argument for the channel’s existence.
- Registered deals per period is a leading proxy for future partner revenue and a direct read on whether deal registration is actually being used.
- Program ROI is the number leadership ultimately asks for: partner-sourced margin against the fully loaded cost of running the program.
The one metric most programs underweight
If you track only one thing, track the percentage of active partners — the share of your signed partners who’ve registered a deal, sourced revenue, or meaningfully engaged in the last 30/60/90 days.
A program with 100 signed partners and 12 active ones doesn’t have a 100-partner channel. It has a 12-partner channel and a data-hygiene problem. Signed-partner counts are the vanity metric of the channel world; the active rate is the truth. Watching it honestly reframes almost every other decision — recruitment (are you signing partners who activate?), onboarding (are they stalling after signing?), and enablement (are active partners staying active?).
From metrics to a channel performance analysis
Metrics on a dashboard change nothing. A channel performance analysis is the periodic act of turning them into decisions. A useful analysis does four things:
- Assess program health. Active-partner rate, partner-sourced pipeline and revenue, win rate, and ROI against your goals. Is the channel growing, flat, or quietly eroding?
- Segment partners by performance. Sort partners into tiers — top producers, steady mid-tier, ramping, and dormant. Revenue almost always follows a power law, so this segmentation is where the insight lives.
- Find the outliers. Which partners are trending down (at-risk) and which are punching above their tier (high-potential and worth more investment)?
- Produce actions. Every analysis should end in specific moves: who to invest in, who to coach, who to restructure, and who to exit. This is the Optimize stage in practice.
Run it monthly at the program level and quarterly at the partner level. Analysis without a cadence decays into a report nobody reads.
The partner scorecard and QBR
The per-partner instrument for all of this is the partner scorecard — a consistent summary of each partner’s activity, pipeline, and results. Three groups of measures:
- Activity — deals registered, portal logins, training and certifications completed, campaigns run.
- Pipeline — registered and sourced opportunities, and their stage and value.
- Results — closed partner-sourced revenue, win rate, average deal size, and margin.
Reviewed in a quarterly business review (QBR), the scorecard replaces anecdote with an objective, shared view of the relationship. Both sides see the same numbers, and the conversation shifts from “how do you feel it’s going?” to “here’s what the data says, and here’s what each of us will do next quarter to grow it.” For your best partners, the QBR is one of the highest-leverage hours in the whole program.
Why your numbers can’t be trusted (and how to fix it)
None of this works on bad data — and channel data goes bad in a specific, predictable way. When the partner portal (PRM) and the CRM drift apart, partner-sourced deals get miscredited or double-counted, registered deals don’t reconcile with closed revenue, and pipeline goes stale. Once people stop trusting the numbers, the whole measurement program dies.
Trustworthy channel metrics require partner activity, deal registration, and closed revenue to flow between the PRM and CRM so everything reconciles to a single source of truth. This is why native, two-way CRM integration matters more for measurement than any dashboard feature: the prettiest report built on drifted data is worse than no report, because it’s confidently wrong.
Common channel measurement mistakes
- Watching only revenue. It’s a lagging signal; by the time it dips, the problem is a quarter old.
- Counting signed partners as if they were active ones. The active rate is the real size of your channel.
- Too many metrics. A dashboard of fifty KPIs obscures the five that matter. Track a balanced handful and act on them.
- Measuring without a review cadence. Numbers no one reviews change no behavior. Scorecards and QBRs are where metrics become decisions.
- Trusting drifted data. Metrics built on an out-of-sync PRM and CRM are confidently wrong — fix the data foundation first.
Measurement is what makes channel management a discipline rather than a hope. Watch the leading indicators, analyze on a cadence, and keep your data reconciled to one source of truth. If you want partner activity, deal registration, and reporting on one CRM-synced foundation, you can launch a free partner portal, or compare the options in our guide to the best PRM software.
Frequently asked questions
What are the most important channel performance metrics?
The most important channel metrics balance leading indicators — percentage of active partners, partners onboarded and certified, registered deals per period, portal engagement, and time-to-first-deal — with lagging indicators like partner-sourced revenue, partner-sourced win rate versus direct, partner retention, average deal size, and program ROI. The single most predictive number in most B2B channels is the percentage of partners active in the last 30/60/90 days.
What's the difference between leading and lagging channel indicators?
Leading indicators predict future results — partner activity, onboarding and certification completion, registered deals, and portal engagement all signal what revenue is coming. Lagging indicators confirm what already happened — partner-sourced revenue, win rate, retention, and ROI. Programs that watch only lagging indicators find out too late that a partner has been disengaging for a quarter; leading indicators let you intervene early.
How do you measure channel partner performance?
Measure each partner against a consistent scorecard combining activity (deals registered, portal logins, training completed), pipeline (registered and sourced opportunities), and results (closed partner-sourced revenue, win rate, deal size). Review the scores on a regular cadence — monthly at the program level, quarterly with each meaningful partner in a business review — and use them to decide who to invest in, coach, or exit.
What is a channel performance analysis?
A channel performance analysis is the periodic review of how your channel and its partners are performing against goals. It looks at program-level health (active-partner rate, partner-sourced pipeline and revenue, ROI), segments partners into performance tiers, identifies at-risk and high-potential partners, and produces specific actions — where to invest, who to coach, and who to prune. It turns raw metrics into decisions.
What is a partner scorecard?
A partner scorecard is a consistent, per-partner summary of the metrics that define performance — activity, pipeline, and results — usually reviewed in a quarterly business review (QBR). It gives both sides an objective view of the relationship, replaces anecdote with data, and frames the conversation about what each side will do next to grow the partnership.
What is a good partner activation or active-partner rate?
It varies by program and partner type, but the number to watch is the trend, not a universal benchmark. A program with 100 signed partners and 12 active ones has a 12% active rate and, in reality, a 12-partner channel. Many healthy SMB and mid-market programs run well below the active rates they assume; the discipline is measuring it honestly and working to raise it, rather than counting signed logos as if they were producers.
Why do channel metrics require CRM and PRM integration?
Channel metrics are only as trustworthy as the data behind them. When the partner portal (PRM) and CRM drift apart, partner-sourced deals get miscredited or double-counted, pipeline is stale, and every report becomes suspect. Accurate channel performance analysis depends on partner activity, deal registration, and closed revenue flowing between the PRM and CRM so the numbers reconcile to a single source of truth.